Parametric Fourier Filter
|
I have always been a fan of Cool Edit's built-in Fourier
filter, which
can do extreme yet quite precise filtering. For some time I
daydreamed about making a similar filter for
real-time audio processing. The curve in my filter should be controlled
by a few parameters, and not by drawing innumerable points on the
computer screen. The key to a musically effective multiband filter is a
logarithmic distribution of center frequencies and bandwidths, which is
better set by mathematical formulas than by eye and hand.
|

|
When starting out, I was still unaware of some issues related to
spectral processing, notably the resolution/latency trade-off. Soon, it
became clear that the linear character of a DFT spectrum output would
not allow a 32-band filter,
if
at the same time an acceptable latency for real time purposes
were to be retained.
The Fourier filter can not replace a time domain filter (bank) in
all situations. While learning about these limitations the hard way, by
trial and error, (because I am too stubborn to take wise people's words
for granted) I worked out my parametric Fourier filter and made the
best of it, given the conditions. The result so far is a relatively
light-weight and flexible routine, linking the appreciated sound
characteristic to a surprising ease of handling. Let me reveal some
details of the concept.
 |
The essence of my filter's amplitude spectrum is a plain
logarithmic curve. On the
left, part of the natural logarithm curve ln(x) is plotted. For any
base logarithm, x[0] always has y=-infinity and x[1] has y=0.
|
 |
A very famous one is the base-2 logarithm. It is not on pocket
calculators or in the standard C-library. But it is easily computed
with 2log(x)=ln(x)/ln(2.). I have set black dots at the
base-2 logarithms of 1, 2, 4, and 8.
|
Base 2 or radix 2 is the number system for computers, the binary
system, so base 2 exponents and logarithms are implicitly used all the
time. It also happens to be the 'octave-logarithm', describing how
frequencies relate to octaves in pitch perception.
Spectrum coefficients represent frequencies in terms of harmonics of
the DFT fundamental. The fundamental is a sinusoid with one cycle
fitting exactly in the
analysis frame. Coefficient x[0] represents the DC component, and x[1]
represents the DFT fundamental. It's frequency in Hz depends on the DFT
size and samplerate, but coefficient x[2] is always the second
harmonic, being the octave of x[1]. x[4] has another octave, then x[8],
x[16], x[32] and so on. The pattern is, that the octaves are at x[2n],
n being an integer. Inbetween coefficient x[0] and x[1] are infinitely
many more lower octaves, none of which can be represented as such. An
impression of that is plotted below. The black dots indicate spectrum
coefficients and the continuous line shows peaks at octaves.
From this, it is clear that filterbands smaller than octaves are
impossible in the lowest frequencies region. Higher up, the pitch
resolution gets better, and it is possible to create narrow peaks at
octave intervals:
Upward from bin x[30], the resolution would allow isolated bands at
third-octave intervals, like plotted below:
Specially the third-octave bands make a multibandfilter 'sing' rich
and harmonically, but larger intervals have interesting characters as
well. By the way, a time domain third-octave filter with all it's bands
up is not supposed to sing at all, but due to phase cancellations, they
have that tendency, which has become an appreciated sound in itself.
With Fourier filtering this can be pushed to the extreme, but the
lowest bands are not controlled with precision and tend to just
disappear in many cases.
I could now compute what FFT size is theoretically required to do
such extreme filtering. Say I want to control third octaves from 40 Hz
up with fair precision. My first guess is that a 215 point
FFT
would do. Let's see: 215 is 32768 points. With samplerate
44k1 this makes an FFT fundamental of 44100/32768 = 1.3458 Hz. Harmonic
30 is at 30*1.3458 = 40.3 Hz in that case, and that is where the
filtering would start being more or less precise. A 32768 point FFT is
not so extravagant in itself and may take a millisecond CPU time, but
all these samples have to be collected before a frame can be processed.
That takes 743 milliseconds! Blah....
Now you see where the bottleneck is with spectral filtering. I could
not find a compromise that can pair acceptable latency to the precision
needed for my extremest filtering desires. I will have to switch FFT
sizes according to the purpose, and not use the third octaves (or the
Fourier filter at all) when
timing is crucial. In practice, I found a 213 point FFT
sufficient for needle-thin bands at third-octave intervals. I typically
use wide-band noisy input for such filtering, and the lower bands seem
fairly well preserved. A 210 point FFT can not do this, but
will serve for most other purposes. This FFT length can also be abused
for extreme filtering, but it may introduce artefacts, which are
welcomed in some cases and abhorred in others. More on artefacts later,
let me now illustrate the mathematical operations that I use to
construct multiband filter spectra.

|
Indexing starts at x[0] but I want to avoid the minus
infinity result of ln(0.), which would propagate through all subsequent
operations and might lead to Not A Number somewhere. I simply add 1 to
x before taking the logarithm. This is a distortion of the perfect
logarithmic flow, but it also makes the disappearing-band effects
less systematic, which is an advantage.
|
The logarithmic curve will supply the phase arguments for a (co)sine
function,
to create a logarithmic sweep. In order to normalise the sweep somehow
to the FFT size, the logarithmic curve is first multiplied with
pi/ln(FFTsize/2). The FFT's half framesize equals the number of
spectrum coefficients, with the conjugates left out. The multiplication
does not take away the
logarithmic character of the curve.

|
Here is the example for one filterband on a 512 point
spectrum. The asymmetric appearance matches the logarithmic nature of
pitch perception.
|

|
Multiplying the one-band log curve with 2 before computing the
sinusoid, makes the sine rotated over a total of 2 pi within the 512
point
spectrum.
|

|
With the abs() function the sweep is rectified, and exactly
two filterbands result.
|
 |
By simple multiplication of the initial log curve I could
effectuate any desired number of
filterbands. It need not be an integer number. Here I have set 2.5
bands.
|
 |
Raising the complete function to a power alters the slopes. A
power inbetween 0 and 1 is actually root extracting and makes less
steep slopes, till the point of a flat spectrum at power 0. Be careful
not to set a power below zero!
|

|
Powers above 1 make steeper slopes. Here is the rectified
sweep raised to the power of 3.
|

|
Of course I also want to control the center frequency of the
filterbands. This can be done by simple phaseshift of the sweep. Very
conveniently, the bandwidth varies with position and it seems to retain
it's Q factor.
|

|
The constant Q works because the sweep originates from a
logarithmic curve. The plot here illustrates how a -pi/2 phase shift
makes dips exactly at the positions of the peaks in the original
function, and vice versa.
|

|
Finally, I multiply the sweep with factor 1.5 and clip at y=1.
Each band will then get a flat region, which gives them better
definition.
|
The passive filtering process generally reduces the output energy, and
with narrow peaks the loss can be substantial. Therefore I implemented
a partial amplitude compensation, linked to the power function. The
integrated area under the sweep diminishes inversely proportional to
roughly the square root of the power to which the sweep is raised. A
power of 16 would theoretically require a factor 3.5 amplitude
compensation, and a power of 64 (my maximum) require a factor 7
compensation. Due to perception issues and limited headroom, that is
way too much in practice. For now, I have set a maximum amplitude gain
factor 2, which may be a little conservative.
After some experimenting, I decided my filter could do with three
user parameters:
- number of filterbands (from 1 to 32)
- Q factor adjustment (starting at flat spectrum)
- frequency position of filterband(s)
All settings in the examples below are done with just these
parameters:

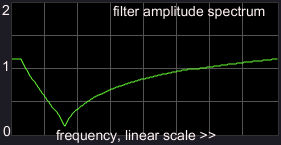
(1) almost flat spectrum
|

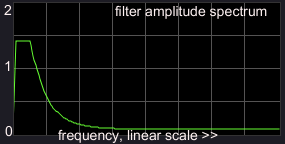
(2) increased Q factor
|

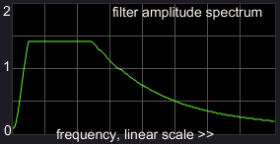
(3) further increased Q factor
|

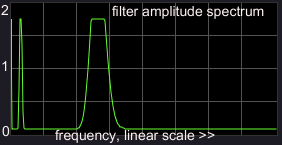
(4) frequency shift, Q factor retained
|

(5) more filterbands
|

(6) frequency shift, Q factor retained
|

(7) further Q factor increase
|

(8) more filterbands
|
on artefacts
Creating steep slopes in a
filter spectrum can introduce artefacts in
the filtered signal, as I could clearly hear. How come? I think it
is because frequencies in a signal are never correlated by one single
Fourier coefficient, but the correlation is always spread over more
neighbouring bins. Zeroing out part of these correlation coefficients
and leaving the others, will create frequencies which were not in the
input signal.
For a short while, I was seriously disappointed by the poor results
of Fourier filtering. Then I remembered about FFT window types
influencing the spectral smearing character. I tried overlapping 4 FFT
frames instead of the regular 2 frames. The extra overlap turned out to
be more decisive than the window type. This resolved my problem to a
large extent,
at the
price of extra FFTs. But FFTs are not so expensive at all. At least I
could now use the Fourier filter with more extreme settings for
delicate
signal types like voice processing. Later on, I have done minute
experiments to find the best windowing options for the
Fourier filter. It is documented on the page FFT Windowing &
Filtering.
I prototyped the Fourier filter as a Max/Msp patch. The patch is
extensively commented on the next page, Fourier
filter in Max/Msp.


