
Since chirp Z transform can zoom in on a specific segment of a signal's
spectrum, I would think it can be used for downsampling or upsampling
purposes. That is indeed the case. I did not now what to expect
precisely, so I figured out by experiment how to do it.
Below is a test function consisting of two cosines with periodicity
1 and 3 in an FFT framesize of 1024 samples.
 |
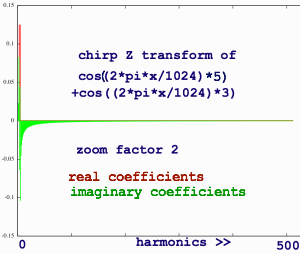
I zoom in on the spectrum with zoomfactor 2. As ever, this spectrum
looks inconspicuous:
 |
I feed this spectrum in a regular inverse FFT. What comes out, is
the signal downsampled by a factor 2:
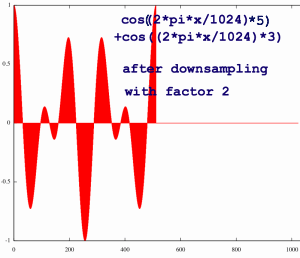 |
So by zooming in on the spectrum, which is in fact upsampling, the
signal can be downsampled. That is funny. Of course, this downsampling
was not such a difficult task. It could be done by taking away every
other sample, instead of the chirp Z transform with it's two complex
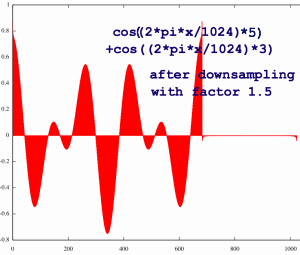
FFT's of double size, plus a regular inverse FFT. Therefore, I will try
a weird downsampling factor like 1.5:
 |
Such downsampling can also be done by 'fractional resampling', where
you first upsample and then downsample, the factors being a ratio of
relatively prime integers. That would require a lot of filtering. But,
can chirp Z downsample without filtering? To check this, I add a
frequency in the second half band, at harmonic 280 (Nyquist is at 512).
This is my test signal:
 |
Doing chirp Z transform with zoom factor 2.2, for example, the
upsampled spectrum has a peak above the Nyquist frequency, originating
from harmonic 280. That peak has no conjugate. In fact, after
stretching the spectrum, nothing has a conjugate anymore.
 |
Reverting this spectrum back to time domain, would give the signal
plotted below. The high frequency comes from the peak above Nyquist. It
can not be harmonic 280 since the downsampled signal has harmonics up
till around 230 in the positive range. It is an alias of a frequency
that was not in the original, and should be eliminited.
 |
The solution seems simple. When we are in frequency domain anyway, a
mirrorsymmetric spectrum can be computed from the first half, to get
rid of aliases. The result is a bandlimited & downsampled signal:
 |
Chirp Z can downsample with any factor, integer or not. On the
previous page I zoomed in on a 1024 point spectrum with factor 200. An
inverse FFT of that would give a 5 point signal, pretty useless I would
think. Here is my test signal downsampled with factor 8, to have
another impression:
 |
As the signal gets sleeker, the sample value peaks grow. Apparently,
the increase is proportional to the zoomafactor so this can be
compensated in the normalisation. Also notice that the 'empty' range is
not really empty, it even starts with a dreadful peak. A similar peak
appears at the start of the
downsampled signal, although it is hard to see in the plot. Let me do a
magnified plot of the first 75 samples. It turns out that the signal
extremes are not so perfectly interpolated at all. The distortion is
probably caused by the mirrorsymmetric spectrum computation. Relevant
information about the waveshape was in the second spectrum half, which
is erased by that action.
 |
I wanted to try signal upsampling as well. With that I had such
weird results, until I realised the input signal should leave room for
expansion. Just like the downsampled signal shrinked and thereby made
room. So here is my input test signal again, but at half the
length of the analysis:
 |
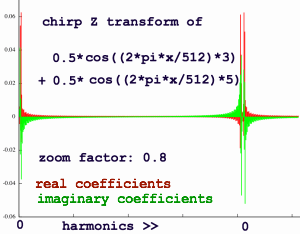
I feed it into the chirp Z transform with zoom factor 0.8. That is
zooming out instead of zooming in. What happens when zooming out? The
opposite of zooming in. It is hard to imagine what that means. Only
after experimenting, I could understand the effect. You are not seeing
a segment of the spectrum,
but the whole of it and even a bit more. While the spectrum shrinks,
point N
(1024) which is also point zero because of the periodical nature of the
transform, moves leftward. In the plot below you can see how the
coefficients in the lowest part of the spectrum are thereby copied to
the right of this shifted N aka zero point.
 |
Just like with zooming in, the spectrum is not mirrorsymmetric
anymore. Reverting this to time domain as is, will give the signal
plotted below.
The upsample factor is the reciprocal of the spectrum-zoom-factor:
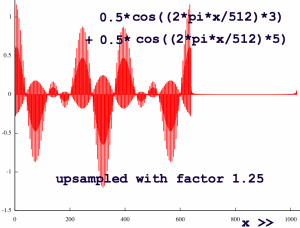 |
The high frequencies here are what they call 'image' frequencies,
because they are kind of ghost image from the lower spectrum part.
Images will always appear in an umsampled signal, no matter how
bandlimited that signal was. With chirp Z we can get rid of the images
by computing a mirrorsymmetric spectrum from it's first half, exactly
like it was done for downsampled signals. Now I get this nicely
stretched output:
 |
Upsampling with chirp Z brings an extra problem that must be
handled. So far, I did low frequencies and it worked well. But with
high frequency content in the original, we will be bothered by
conjugates. After all, with point N shifting leftward, the conjugates
also shift leftward. Let me enter a high frequency to check what will
happen. First do a non-zooming transform to see the original spectrum:
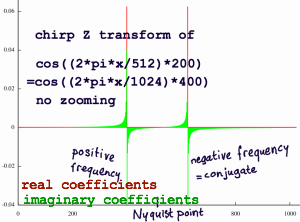 |
If I zoom out using factor 0.75, the negative frequency correlations already tresspass the middle of the analysis frame in their leftward movement:
 |
We have to perform bandlimiting to eliminate such tresspassers. The
Nyquist frequency must be tracked in it's movement.
It moves like:
shiftedNyquist = Nyquist * zoomfactor
Everything between shifted Nyquist and original Nyquist must be zeroed, before computing the mirrorsymmetric spectrum.
To visually check if this works, I have to upsample the signal
drastically with factor 100. Otherwise we will only see those
indefinite needle bunches. On the left is
the non-bandlimited output. It is diluted with zero's, which means it
has alias frequencies. On the right
is the bandlimited output, it has the pure transposed frequency.
 |
 |
This extreme upsampling was done for testing purposes, but
it would not have worked if there had been frequency content below
harmonic 100
of the analysis width. Such content would wrap around in the limited
space. There is however also this option to rotate the
whole spectrum with a frequency offset. If we make the bandlimiting
function dependent on the frequency offset as well, the options for
resampling increase further. Although the offset is effectuated by
complex multiplication, the offset itself is not a factor but a
frequency addition. To find
the frequency cut off point:
shiftedNyquist = (Nyquist-frequencyoffset) * zoomfactor
Using this modification, I have checked
that exactly the same result as in the above experiment can be obtained
with a frequency offset of harmonic 392 (harmonic respective to
analysis width) and zoom factor 0.5. But now without worries about
possible distortion by low frequencies. In serious applications, this
bandlimiting should probably be done with some very short curve instead
of hard cut.
In this quick test of chirp Z as resampling method, I have not
touched on all possibilities. But so far, I am impressed. The method is
computationally intensive, on the other hand it is very flexible.
Spectrum rotation for example, is 'included in the price'. You can
magnify any aspect of a signal by a combination of rotation, zooming
and filtering in one single process.