The previous page illustrated how Bluestein's identity, with all those
chirps in it, enables a more flexible transform type than Discrete
Fourier Transform. I was impressed by the accuracy of the method when
inputsize N = outputsize K. Despite the dizzying rotations it seems to
be as precise as regular DFT. This encouraged me to go ahead and
explore the zooming options of chirp Z transform.
For zoom chirp Z, the transform formula is slightly modified with
two
extra phase parameters. The first one is an angle phi in the
definition of W:
 |
With this parameter, the acceleration of the chirp can be set. Below
unity, the spectrum will be covered partly instead of completely. Above
unity, the spectrum will fold over itself.
The other thing is an extra rotation of the input signal with a
factor:
 |
This factor with theta is an addition to the chirp that already
rotates the signal. It is a fixed frequency offset. This complex
exponential is sometimes abbreviated A-n to keep formulas
simpler. Even with all complex exponentials hidden behind capitals, it
looks complicated enough:
 |
The phi and theta parameters together outline the region of the
spectrum that will be covered. With theta being a frequency offset, it
sets the lower boundary. Phi acts as the reciprocal of a zoom factor:
when phi gets smaller, you zoom in on the spectrum. Adding these
arguments to Bluestein's algorithm, if you have that already
implemented, is relatively simple.
I can hardly wait to test this. So here we go. On the left below is
the dull non-zoomed spectrum of cosines with periodicity 5 and 6. In
the plot on the right I zoom in with a factor 20. Wahh.. the two points
are heavily smeared out.
 |
 |
Maybe it is better to do amplitudes instead of real and imaginary parts
for one time. Then we do not have to see those dreadful phase
rotations. To compute amplitudes I do Pythagoras on real and imaginary
parts, and a factor 1/2(1/2) for complex to real
normalisation, plus a factor 2 compensation for the input/FFTframesize
ratio of 1/2. Below I did harmonic cosines 5 and 6 again but now with
zoom factor 100:
 |
From this spreaded data, the correct values can not be retrieved
anymore. Actually, the non-zooming transform was more precise, although
it's plot was not very helpful for inspection. But in real life, one
does not always start out with such perfect harmonic cosines. In case
the original data was smeared out anyway, a zoom-in may offer a
relatively favourable analysis.
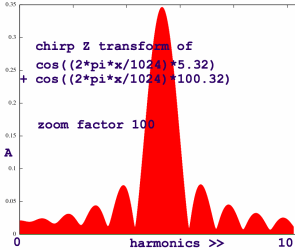
For a next testcase I entered cosines with periodicity 5.32 and
100.32. A non-zooming transform shows the major peaks at index 5 and
100. Smaller peaks at index 6 and 101 tell that the actual frequencies
must be somewhat higher. One may do an educated guess about it, that is
all.
 |
0 0.021106 |
Let us now zoom in on the lowest ten harmonics. The middle of the peak
is at index 532. The amplitude at index 532 is around 0.35. Recall that
the other half of the amplitudes are in the conjugates, which are now
far beyond our scope. The amplitude of sinusoids is 1/2(1/2)
or around 0.707.
 |
527 0.348276 |
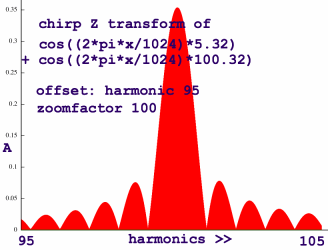
To inspect the coefficients for the cosine at periodicity 100.32, I
choose an offset of periodicity 95. So that is where the view starts.
With zoom factor 100, harmonic 100 will be at index 500. The peak is at
index 532 and the amplitude there is slightly over 0.35.
 |
527 0.351905 |
These results are amazingly accurate about periodicity. When zooming
in, the coefficients are spreaded out over more bins. So, zoom chirp Z
is a weird interpolation technique. It is quite effective, though. In
the testcase, a small segment of the spectrum was in fact upsampled
with a factor 100. That is not even the limit.
It is sometimes stated that chirp Z transform can expand a
spectrum's resolution. That is why I got interested in the first place.
Yet some people firmly contradict this statement. Now that I have
played around with chirp Z, I think that both views miss the point
partly. Chirp Z has two kinds of resolution: input resolution and
output resolution. About the input, chirp Z can not change anything.
When you feed it a mix of two frequencies which are not orthogonal
within the framesize, there is no way to resolve these frequencies. It
is not a defect of chirp Z transform that it can not see such
frequencies seperately, because they simply are not separate frequencies over
that period. Extending the framesize is the only thing that would help.
Let me do a case with cosines of periodicity 5.2 and 5.8, to check
what happens. The plot shows one single blob, with it's highest point
at index 551. The blob is not higher but certainly fatter than the ones
in the previous case.
 |
546 0.357322 |
For comparison I entered two cosines of periodicity 5.5. The result
is completely different, peaking at amplitude 0.7.
 |
547 0.704130 |
Apparently, for non-orthogonal frequencies chirp Z transform can at
least compute an energy distribution within a single bin of the input
resolution. The increased output resolution brings information that you
would not have otherwise.
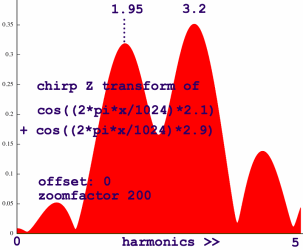
Let me push it to the extreme by zooming in on only five of the
original 1024 bins. Cosines of periodicity 2.1 and 2.9 were entered.
They are peaking at 'harmonics' 1.95 and 3.2 however. That is not a
consequence of the zoom factor, but of these frequencies being near to
each other. Their ripples mutually distort their correlations. This
means you can not trust the peak positions in cases like these.
 |
The ripples in the zooming transform do not represent frequencies in
the signal input. They are not so much consequence of regular leakage,
but an artefact introduced by spectrum upsampling. The ripples
represent discontinuities in the downsampled signal which is the time
domain equivalent of the upsampled spectrum. Details of that are on the
page Chirp Z
Mechanism. Smoothing the input with a window will eliminate
boundary discontinuities, but at the same time introduce it's own
distortion of the spectrum.
All together, I have no idea if or when chirp Z is useful for
zooming in on the spectrum. Anyway, there is an option to zoom out on the spectrum, thereby
upsampling the signal. That may be a method to get a better view of
details in time domain. Resampling with chirp Z transform is discussed
on the next page.