FFT window and overlap

|
 |
I got interested in FFT window types when
designing my parametric
Fourier filter, which is supposed to do extreme
filtering in frequency domain. The filter seemed to benefit from
windowing and 4 times overlap of FFT frames. My ears were
convinced, but why and how does it work? On this page I want to figure
that out in detail.
Windows are designed to reduce the problem of spectral leakage.
Leakage
occurs with every frequency component that is not harmonic with the FFT
fundamental. The correlation for such an inharmonic sinusoid will
spread over all bins. There is a peak and a base
in the spectrum of this sinusoid, but the contour can be manipulated by
applying one or the other window type. Window functions are multiplied
with the FFT input
signal. They modulate that
signal, thereby altering the leakage character of the analysis.
Using no window whatsoever is equivalent to a rectangular window,
which multiplies the input signal with 1 at all indexes of the FFT
frame and 0 elsewhere.
 |
A simple smooth
window function is the Hann window (named after Julius von Hann), and
it
looks like this:
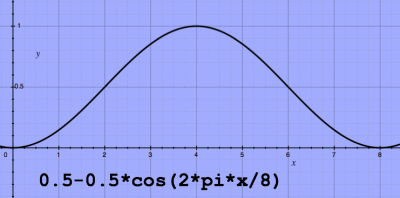 |
The function is identical to sin2(pi*x/8).
Intuitively, I would think a window should be symmetric. The plot
looks symmetric at first sight, but here, as so often, a
one-sample-complication pops up. Should the Hann window be defined
0.5-0.5cos(2*pi*x/N) or 0.5-0.5cos(2*pi*x/(N-1))? I found both (amongst
even more) definitions, from various sources. Following the first
formula for N=8, the eight discrete samples of the window function can
be plotted at indexes 0 - 7:
 |
That is not symmetric! So let me try the second formula, with N-1 as
the divisor, for the same N=8 case:
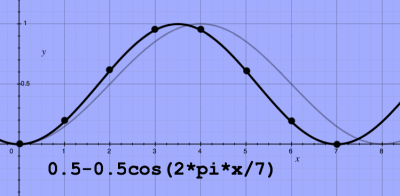 |
Now the window is symmetric. But it does no longer have the FFT's
periodicity. Despite my initial preference for a symmetric window, I
now tend to believe it should rather match the FFT's periodicity than
be symmetric. We will encounter some arguments for that later on.
Below, the terms of the (non-symmetric) window are
plotted
separately:
 |
Both terms are frequency components of the Fourier matrix proper, and analysing an N-point Hann window with an N-point DFT, the spectrum magnitude coefficients are:
x[0] 0.5 (DC)
x[1] -0.25 (fundamental)
x[N-1] -0.25 (conjugate of the fundamental)
The window function 0.5-0.5cos(2*pi*x/N) can also be identified as:
0.5+0.5cos(2*pi*(x+N/2)/N). Written like that, it shows up as a
time-shifted version of a window centered round zero. With time zero
at
the center of an FFT frame, the window's cosine component is at zero
phase and thus positive:
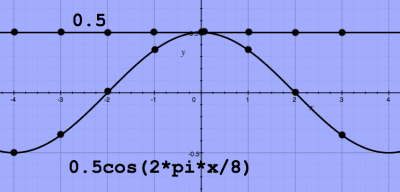 |
The sum of these terms is equal to cos2(pi*x/8), and the
Hann window is sometimes called squared cosine window. In terms of
frequency components, very few windows are simpler than
Hann's. But is it effective? Before running this and other windows on
test functions, and analyse effects, I need to raise another (in
retrospect quite naive) question.
Since a window is actually an amplitude modulation of the FFT input
signal, must we not demodulate after reverting from frequency domain to
time domain, to restore the signal? The focus in text(book)s is always
more on
analysis than resynthesis. Till now I have seen very little comment on
this, and the
following
it just my guess.
It seems to me that demodulation or de-windowing is impossible with
a window like
Hann's. Since the function has some very small
values and even a zero, the multiplications can not be inverted. So,
should we use a different window type in case of FFT/IFFT jobs? Like
the Hamming window, defined 0.54-0.46cos(2*pi*x/N), which has larger
values at the extremes? In that
case, demodulation would be an option. But must we demodulate
anyway? Generally, FFT/IFFT is done with window&overlap. With 2
times overlap, and using the (non-symmetric!) Hann window, the sum of
the overlapping
window functions is exactly 1 everywhere:
 |
The constant sum implies a proper reconstruction of the signal after
IFFT and summation of the overlapping frames. This will not be the case
with
the 0.5-0.5cos(2*pi*x/(N-1)) formula. So that could be one reason to
use a non-symmetric window function.
The constant sum arises from the fact that a cosine function has
a mirror-symmetry in the vertical direction. Adding more cosines of
different
periodicity to the window function will make it sleeker and disrupt the
vertical symmetry. Below, two-times-overlapping Blackman windows are
plotted, with formula 0.42-0.5cos(2*pi*x/N)+0.08cos(4*pi*x). The sum of
these is not a constant at all:
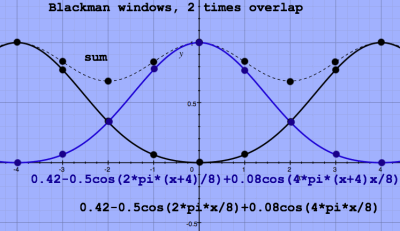 |
The fluctuating sum translates in amplitude modulation of the
reconstructed signal after IFFT. Theoretically, this modulation could
be undone after summing the
reconstructed frames. But it would mean that certain portions of the
complete signal have less weight in the analysis than others, that's
not fair.
When four-times-overlapping Blackman windows are plotted, and the
sum of these, a neatly constant sum appears again:
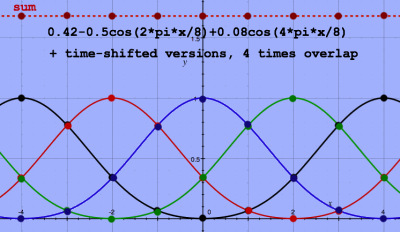 |
From these plots I can understand why some window types can not be
used with two times overlap, and require four (or maybe even more)
times overlap.
The particular windows I plotted so far had
only a few cosine terms, meaning a few spectrum coefficients. But,
analysing or using the window function within an FFT frame, the
few-term function is actually multiplied with a rectangular window! The
spectral effect of that can not be seen when the periodicity of the
window
matches that of the FFT fundamental. But for shure there is a spectral
difference between an infinite length cosine function and a function
that is zero outside the interval 0 - 1. To get a more representative
spectrum of the window, it should be analysed together with a lot of
these zero's.
Below is a spectrum plot of a 16 point rectangular window analysed
with a
much wider FFT, 1024 points.
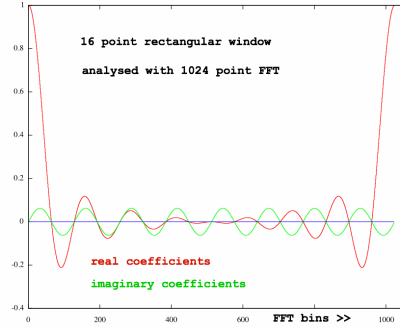 |
The rectangular window has the function cos(0), being all ones, over
the 16 point interval, and zero elsewhere. Analysed with a 16 point FFT
this would give just one spectral coefficient, the DC component. But
now, analysed together with many zero's outside the window, we get a
more realistic impression of it's spectrum.
At this point in my experiments I happened to read Frederic Harris'
excellent article 'On the Use of Windows for Harmonic Analysis with the
Discrete Fourier Transform'. From this, I learned that the shape of the
above spectrum is particular, and it has a name: Dirichlet kernel. It
shows similarity to a sin(x)/x function, but it is periodic.
Without knowing it's name, I already encountered the Dirichlet
kernel when multiplying
and summing the complex
roots of unity, which are part of the Fourier matrix. When more and
more harmonic cosines are summed, the result starts to approach a pulse
wave with the periodicity of the fundamental cosine. The Kronecker
delta
'function' is the ideal pulse, in digital domain existing as a single
value 1 amidst zero's. While the Kronecker delta's Fourier transform
results in a flat spectrum, a sequence of ones, constituting a
rectangle function, has a Dirichlet kernel as it's Fourier transform.
When the ones completely fill up an FFT frame, the Dirichlet-shaped
Fourier transform is no longer recognised because the zero's of the
Dirichlet function exactly coincide with FFT bin locations, as is
indicated here:
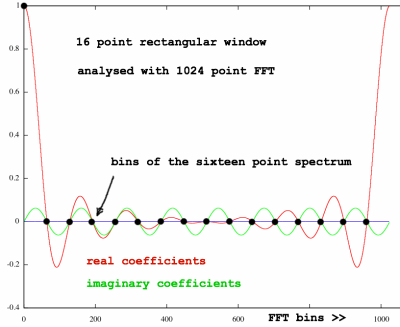 |
When reading about FFT windows, I always wondered how they got those
window spectrum plots with all the so called sidelobes. So now I
understand that at least you have to analyse a window in it's context
of surrounding zero's. It is even more fun to
analyse the constituing terms
of a window, as I have learned from the Harris article. It shows how
the terms cooperate by phase cancellation to create the desired effect.
Below is a spectrum plotted, of a cosine function with the
fundamental periodicity of it's 16 point frame, and analysed with 1024
point FFT. Such a cosine function,
with certain amplitude over the interval
-N/2 till N/2-1, is a term in many window types . Like the rectangular
window itself, by the way, in
it's appearance of framed DC component, constant, cos(0) or whatever
describes a straight horizontal line.
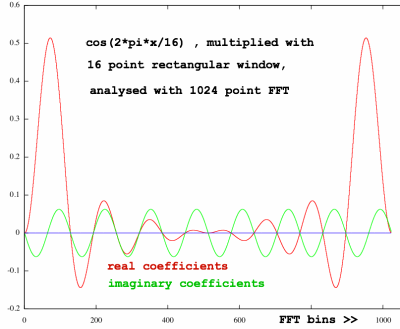 |
Is this also a Dirichlet kernel? Hmm.. not precisely. I normalised
with factor 64 for the larger FFT size, but look, the peaks are not at
0.5, they are slightly higher. That makes me suspicious. Let me plot
the correlations for positive and negative frequencies separately (they
are both normalised with an extra factor 0.5 for this):
 |
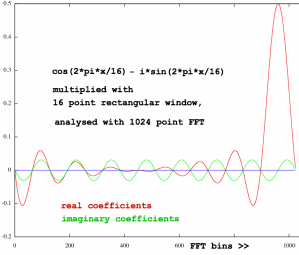 |
They are one Dirichlet kernel shifted rightward (correlating the
positive frequencies) and the other shifted leftward (for the negative
frequencies). The Dirichlet kernel is periodic and therefore the shifts
are really rotations. Which resulted from modulating the rectangular
window in time domain. These things are common knowledge, but when
plotted with these 'inter-bin lobes', it looks disturbing. Positive
frequencies also correlate substantially with negative coefficients? If
they are not harmonic with the FFT framesize, they will correlate with
all bins - positive and negative will happily penetrate into each
others' region. A complicated phase-summation and -cancellation pattern
is the result.
That is also the case when summing a framed cos(0) and
cos(2*pi*x/N). Let me plot the spectra of these functions in one
figure, but not yet summed:
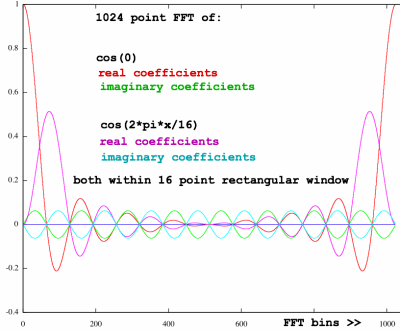 |
It is clear that in a sum spectrum of these terms, many coefficients
will cancel each other. Let me check this by plotting the spectrum of a
window that is composed of these functions, each with half magnitude,
the Hann window:
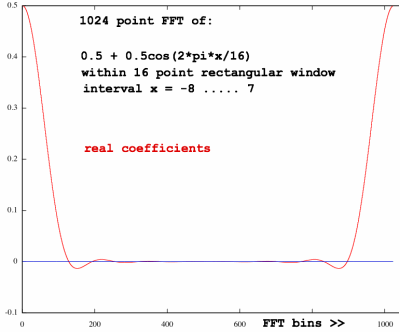 |
Yip... that looks pretty. The real parts outside the region of the
main peaks are substantially reduced. All imaginary parts, resulting
from the
window not being symmetric, are completely eliminated by phase
cancellation. This
Hann-window therefore is phase-neutral. For a window, this phase
cancellation is advantageous, but it also demonstrates how coefficients
can eat each other in a sum spectrum, equally so if you did want to see
them.
The window-analysed-with-larger-FFT represents it's leakage
character, and from there it is possible to express the character in
terms of standardised parameters. In order to better compare
different
window types, the y-values need
to be recomputed on a logarithmic scale, so details
become more pronounced. But I am not going to do that yet, because
first I need to understand what the window actually does to the
spectrum of a signal input.
Just as convolution in time domain is equivalent to multiplication
in frequency domain, the inverse equivalence is also true. Multiplying
the input signal with a window is equivalent to convolution of the
signal's spectrum with the window spectrum. So, the window's spectrum is a convolution
filter, acting on the input signal's spectrum, but normally
implemented as a multiplication in time domain. That is one way to
observe
it. What type of filter does
the Hann window's spectrum represent, with it's three complex
coefficients at x[0], x[1] and x[N-1]? Well... we know how it looks in
time domain: a smooth roll-off from x[0] to x[-N/2] and x[n/2-1]. I
would say it is a lo-pass filter,
which will smoothen an alternating function. Let me just try if that
is correct.
Below is the spectrum of a non-windowed cosine function with
periodicity 10.2 respective to the FFT framesize. I have
chosen a small framesize, N=64, to better perceive an alternating
tendency if present.
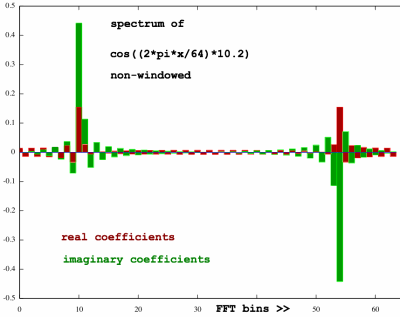 |
Since the function does not harmonize with the FFT framesize, there
is a lot of leakage visible. Apart from the central peaks, the
coefficients do alternate indeed. These alternating coefficients should
now be suppressed to some extent, by applying a window to the input
signal:
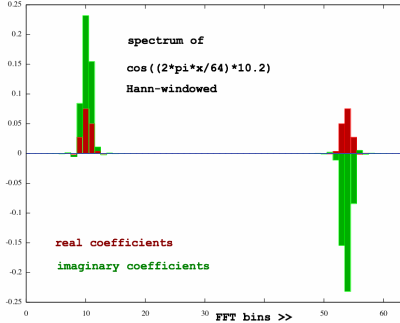 |
Cool, that works quite OK! The spectrum is tidied up, as if the mess
was shoveled up onto the central peaks, wich have grown
fatter. I am kind of exited to see this at work. The window is
a lo-pass filter for the spectrum indeed. Well, nothing could be more
logical, considering the shape of the window, which looks like the
frequency response of a lo-pass filter... Still, I was never aware of
this now so obvious fact.
Why was it not obvious? In fact, I am still confused. I was doing my
experiments with a zero-phase cosine function, using a time-zero
centered FFT. This seems to give correct results. Maybe you have read
my page 'Centered FFT'. It
tries to illustrate how a N/2 shift in time domain results in
alternation (= multiplication by (-1)n) in frequency domain,
and how an FFT routine can be adapted to analyse an array as if it were
centered round time zero. A non-centered FFT should give correct
results as well, but the window is time-shifted by N/2 and it's
spectrum
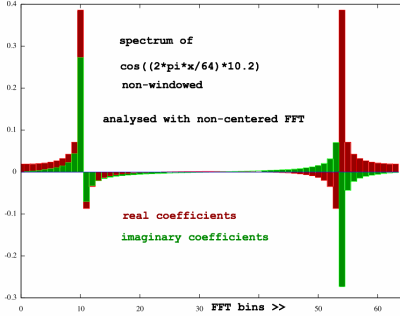
coefficients are alternating. This must be a hi-pass filter then.
Let me check if that is the case. Here is the non-windowed cosine of
periodicity 10.2, analysed with non-centered FFT:
 |
And here is the spectrum of the windowed version:
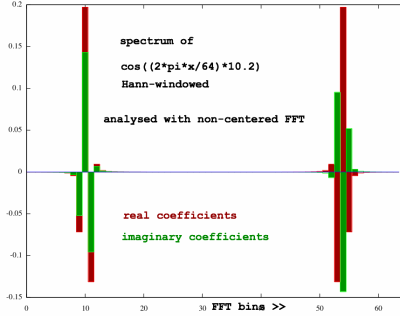 |
High-pass filtering in the non-centered case leads to a similar
effect of tidying up the spectrum. The peak coefficients are
alternating, but that is just one symptom of the phase-shifts occurring
with a shift in time. There is really no fundamental difference in the
window's effectivity. The time-zero-centered case can still be emulated
by multiplication with (-1)n. Look, this is what we get when
analysing with centered FFT, but leaving time zero of the function at
the start of the window. It is still the same sequence of samples as in
the previous plot, but the centered FFT will see
cos((2*pi*(x+32)/64)*10.2).
 |
Although it is a matter of choice whether to evaluate over the
interval starting with time zero or the interval centered round time
zero, I will rather use a time-zero-centered FFT whenever possible.
Time zero is the reference point for phase angles, which are in that
case correctly expressed as running between -pi till pi, not 0 till 2pi
like it is in non-centered FFT. Reducing the risk of misinterpreting
complex coefficients, that is.
window comparison
Now that I start to understand how a window does it's job, I want to
compare a couple of them. We need to see a spectrum with 'lobes',
caused by an analysis frame much wider than the window. The highest
peak should be normalised to 1. To zoom in on details, it shall be
presented on a logarithmic scale. To compute
logarithms, we must first get rid of negative values, zeroes, and very
small numbers. This is done by computing the squared magnitudes and
clipping small values. Since
spectrum magnitudes are normally computed by doing Pythagoras on the
complex numbers, I now simply do Pythagoras without the square root.
That is:
(real coefficient squared) + (imaginary coefficient squared)
A good window does not have imaginary coefficients, but the
rectangle window has them, so they must not be forgotten. These squares
of magnitudes are then converted to deciBels with 10 * 10log(x).
(Notice that this is equivalent to first taking the square roots of the
squared magnitudes and then convert with 20 * 10log(x)).
With the summed squares clipped at a minimum value of 0.00000001, the
y-range will be
from -80 till 0 deciBel, which is where most things happen. Here below
is the rectangle window's spectrum plotted in this fashion. It is a
Dirichlet kernel in logarithmic disguise:
 |
Most authors produce spectrum plots with frequency zero in the
center. So far, I did not follow this convention, but now I feel
tempted to do so. It then makes more sense to speak of 'main lobe',
'side lobes', as is regularly done, and we will get the familiar
phallus-like figures. So here we go:
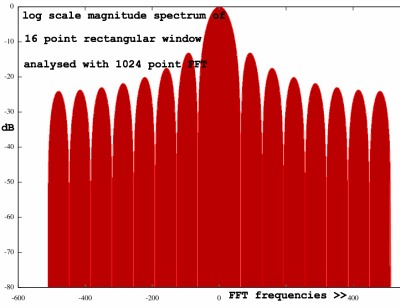 |
The sixteen point window shows fifteen lobes, since there is no dip
at frequency zero.
The way to interpret the figure is: for any frequency bin in a
windowed FFT, an important part of the correlation is in the main lobe,
while another share is distributed over the side lobes. Only when the
analysed frequency harmonises with the FFT size, the leakage falls
precisely inbetween the lobes. Although the analysis of window
functions is by convention centered round frequency zero, a similar
pattern will hold for other bin frequencies, since that is in fact a
matter of modulating the window. You will get one peak for each
conjugate, and the pattern can be distorted by phase effects, as I will
demonstrate later.
Here comes the Hann window spectrum, the one that was used in the
experiments higher up.
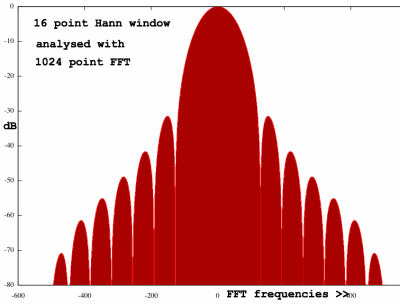 |
The central lobe is fatter. The sidelobes are thinner and, more
important, lower in deciBels, as compared to the rectangular window. It
is the shovel-effect, but now presented in a standardized format.
Next is the praised Blackman window, with definition:
0.42 - 0.5cos(2*pi*x/N) - 0.08cos(4*pi*x/N)
This one spills very little
energy outside the main lobe. There is a 58 dB difference from the
central peak to it's direct neighbours. In return, the main lobe has
grown
really fat, which makes it harder to resolve frequencies that are near
to each other.
 |
16-point window spectrums give a detailed impression of what happens
round the main lobe, but real life FFT's are regularly much larger,
so we also want a view of what happens beyond. I chose to inspect the
same window types but now with 64 points and on a 120 dB range.
 |
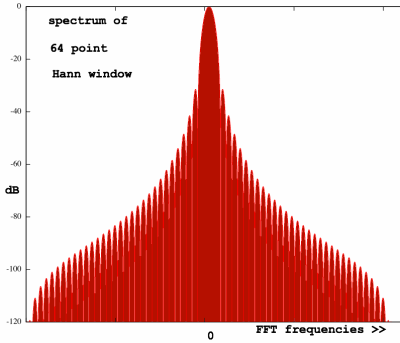 |
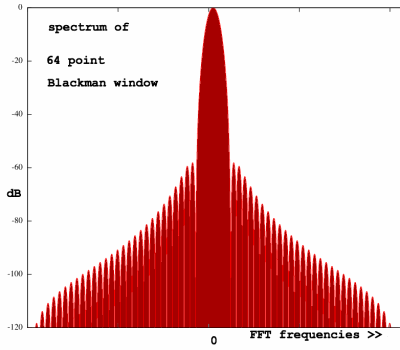 |
The main-lobe-fatness, as related to unit window points, is not
dependent on window size. Neither is the dB distance to the first
sidelobe peaks. Therefore, window characteristics are unambiguous.
The sidelobes of a useful window do not necessarily show a
considerable slope. Some windows are designed to have a fairly flat and
low level of sidelobe peaks, like this three term Blackman Harris
window:
 |
This 'minimum 3-term Blackman-Harris' window is defined:
0.42323 - 0.49755cos(2*pi*x/N) + 0.07922cos(4*pi*x/N)
The terms do not diverge a lot from the original Blackman window,
yet the result is so different. This really demonstrates the delicate
art of window-design. It is not a matter of randomly trying some
values! An even more extreme Blackman-Harris window uses 4 terms:
0.35875 + 0.48829cos(2*PI*n/N) + 0.14128cos(4*PI*n/N) +
0.01168cos(6*PI*n/N)
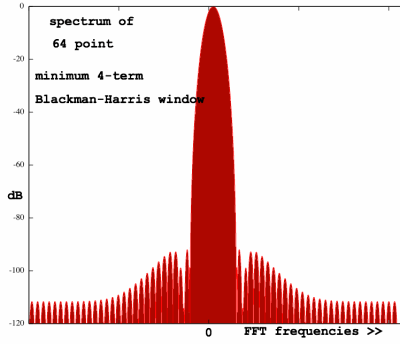 |
I have checked that these Blackman and Blackman-Harris windows give
a constant sum with four times overlap, of respectively 1.68, 1.69292,
1.435 to be precise.
I promised to demonstrate phase effects for a modulated window. When
a signal is analysed with a windowed FFT, the
window is modulated by the input frequencies, or the input frequencies
by the window if you want. Positive and negative frequency correlations
overlap to a certain extent, and produce phase cancellation /
accumulation effects. The effect is best perceived with
the rectangular window, as it has the most prominent leakage
character. After modulation, the central peak of the window spectrum
splitted into a conjugate pair, and the pattern is no longer symmetric
round the peaks:
 |
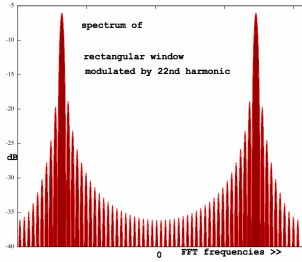 |
We actually see shifted / overlapping Dirichlet kernels on a deciBel
scale. With the other windows, like Hann's, the effect is less
conspicuous, but it is still there.
window choice
Many more window types are available, and their characteristics can
be quantified somehow. I have not tried to do that yet. Above all, I
need to know which aspects are important in my case, that is, the
spectral filter case. Most texts
concentrate on frequency resolution versus dynamic resolution, which is
by necessity a trade-off. You can not have a window with narrowest main
lobe and lowest side lobe level at the same time. So you choose the
window type that best suits your needs.
The resolution question is of concern in analysis and component
detection. That is respectable stuff, but what if we want to process
the spectrum? What is more harmful: accidentally chopping a main lobe
with a Fourier filter, or mowing away the sidelobes that belong to a
frequency? So far, I have seen very few comments on this. Of course, if
there is a lot of energy stored in sidelobes, a filter would attenuate
the wrong frequencies. With steep filter slopes, an amplitude
modulation effect can be perceived. How
is such modulation generated? I need to know that first, before I could
ever understand how to mitigate the effect with a proper window type.